MEASUREMENT FOCUS:
Area
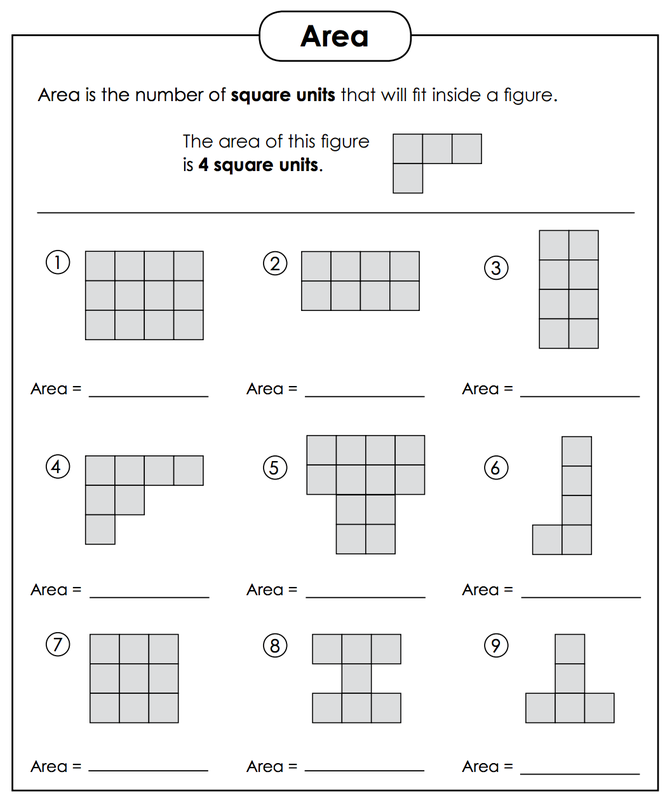
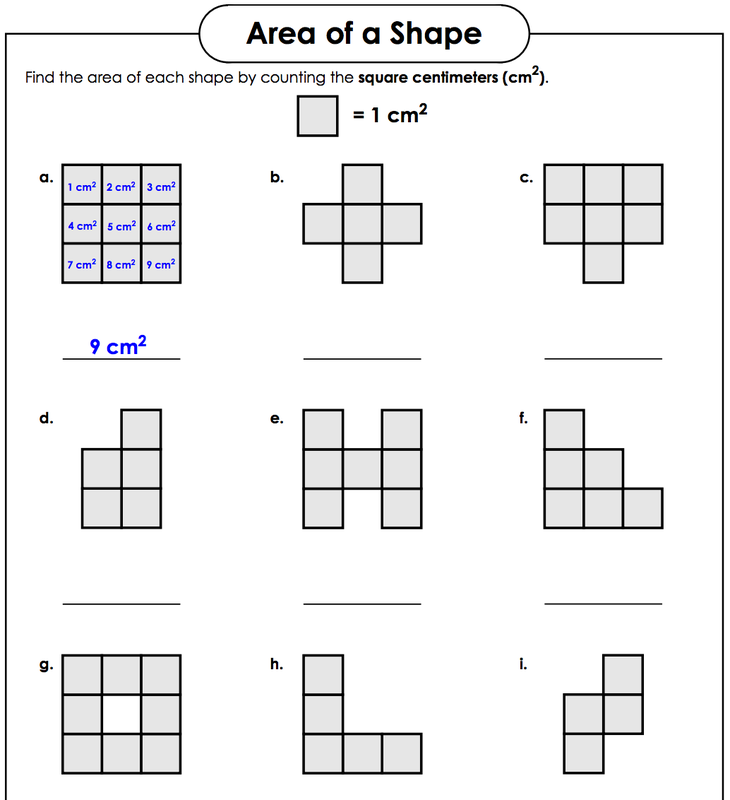
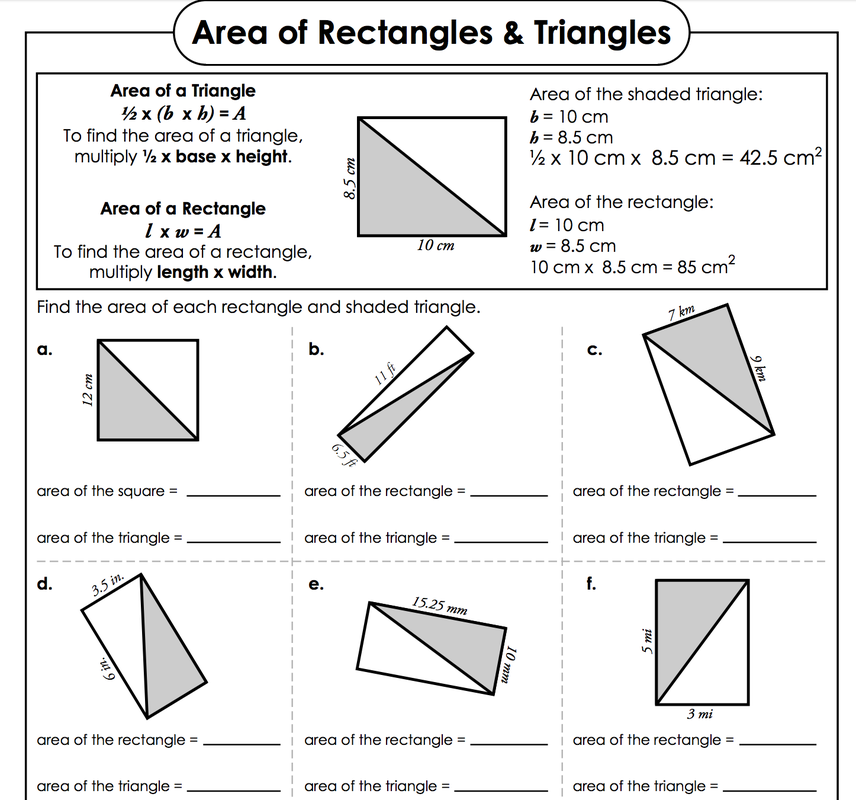
We are learning to calculate the area of regular and irregular shapes.
To do this we will need to:
- Know the units of measurement for length- mm, cm, m, km (metric)
- Measuring length
- Apply multiplication - to work out area
- Apply addition and subtraction to add or subtract parts of shapes from other parts or lengths from other lengths (calculating irregular shapes)
- Break irregular shapes into regular shapes
Learning Focus:
Check out this clip for information about how to calculate the area of regular and irregular shapes
Check out these links for some more information about perimeter and area and how they relate (Click button #1) and area (Click button #2)

Let's practise:
|

|
Statistics
Data #1:
Learning Intention:
Learning Intention:
- I am learning to GATHER, RECORD and INTERPRET data
- I am learning to work in a small group to find out more about Statistics, and to conduct an investigation.
- I’ll know I’m successful when I can:
- write questions that help me gather the information I need.
- record the answers to my questions in an organised way.
- record my information on a graph
- explain the results displayed on my graph
- I could explain what a QUESTIONNAIRE, SURVEY, TALLY CHART, GRAPH, RESULT is
- I could share ideas within my group
- I could listen to the ideas of others in my group.
- I could help others in my group understand like I did.
- I could ask questions from others in my group when I didn’t understand.
Data #2:
Learning Intentions:
We are learning to gather data.
We are learning to create data displays.
We are learning to make statements about displayed data.
We are learning to find averages in gathered data (mode, median, mean)
Success Criteria:
I will be able to:
Decide on a reason for collecting data (or use data given to me)
Record my data on a chart as I gather it
Create a frequency table
Use my frequency table to create a stem and leaf graph
Write three sentences about my data
Use my frequency table or graph to work out the averages of my data
Knowledge I need:
Frequency Table
This is something we have created together many times, find a class expert if you still need help making a frequency table.
Stem and Leaf graph
Group One:
Khan Academy Stem and Leaf Tutorial
Khan Academy Reading Stem and Leaf Graphs
Group Two:
Take a look at the You Tube clip below...
Averages
Here is some information on finding....
The Mode
The Median
The Mean (remember that is the nasty average that takes lots of mathematical thinking and doing!)
Data:
Today you are being given your data....
Group One: This is the group usually with Mrs H
Using the link below...
Create a stem and leaf graph of this week's weather temperatures, you could create one for the maximum temperatures and one for the minimum temperatures. Or maybe you'd like to create one for the wind speeds. Choose two different parts of the weather report e.g. High temperature and low temperature or high temperature and wind speed or low temperature and dew point and graph these. You can then compare the two groups of data when you finish graphing. Write three statements that point out the main trends or patterns in your data.
http://www.weatherzone.com.au/vic/central/ballarat
Group Two: This is the group usually with Mrs Dean
You are going to use the same data as group one.
Create a stem and leaf graph from one of these:
The high temperatures for the week (Maximum) OR the low temperatures for the week (Minimum) OR the Wind Speeds for each day this week
What can you write about what you can see in your stem and leaf graph?
http://www.weatherzone.com.au/vic/central/ballarat
Area
Hi there Grade 3/4 CH and CD.
Here are a couple of tasks for you to try now that you know the basics about AREA.
You will need to use the slider at the left of each task card to see the whole page. The first task is called "Tivaevae Karakara" and the second task is called "An Absorbing Challenge"
If you get stuck you can check out the videos below. Remember you can use a calculator to help you work out the multiplication of the sides!
Our LEARNING INTENTIONS ARE:
How will we know we've been successful? (Our SUCCESS CRITERIA):
Here are a couple of tasks for you to try now that you know the basics about AREA.
You will need to use the slider at the left of each task card to see the whole page. The first task is called "Tivaevae Karakara" and the second task is called "An Absorbing Challenge"
If you get stuck you can check out the videos below. Remember you can use a calculator to help you work out the multiplication of the sides!
Our LEARNING INTENTIONS ARE:
- We are learning to work out the area of squares and rectangles (regular shapes).
- We are learning to work out the area of irregular shapes (these are shapes that could be a mixture of two shapes - say a square and a rectangle joined together, or unusual shapes like a blob).
How will we know we've been successful? (Our SUCCESS CRITERIA):
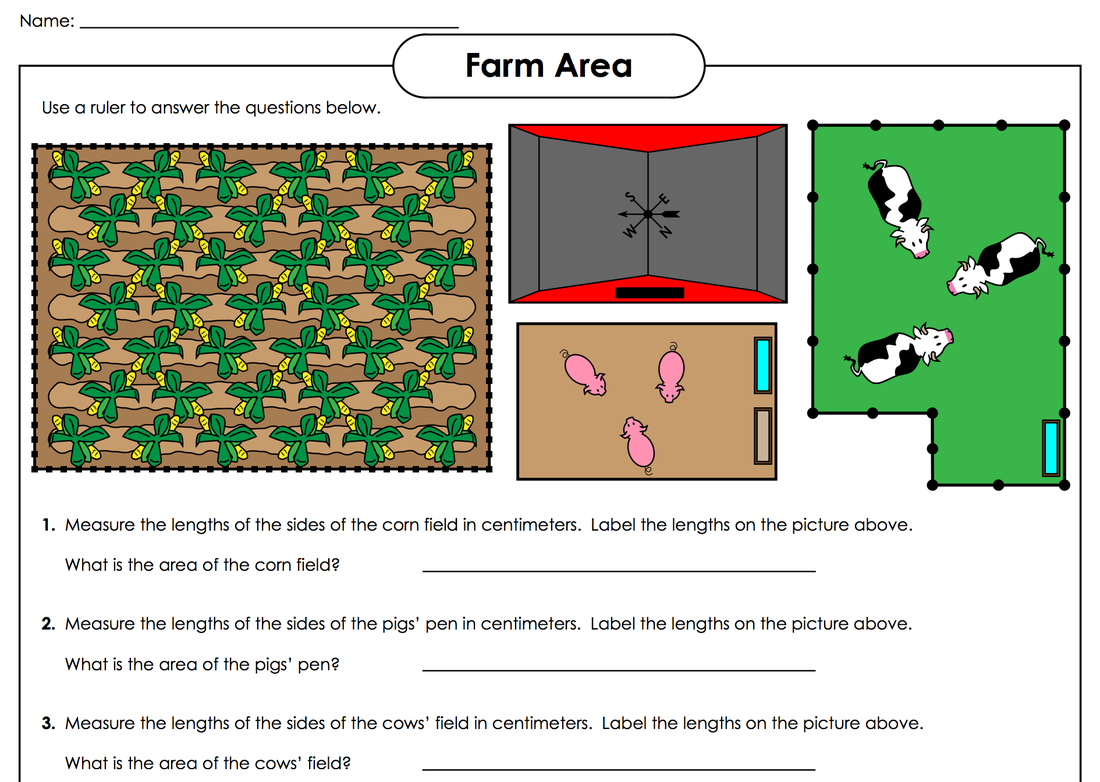
- We will find the length and the width of a shape and MULTIPLY these two numbers together to find the area of a regular shape.
- We will separate the two shapes that make an irregular shape and work out their areas separately then ADD the two areas together to find the TOTAL area... OR we will count the squares on squared paper to estimate (make a good guess using information) their area.